Drafting Report
These charts display information about Victorian state elections from 2006 to 2022. The Electoral Matters Committee created all charts based on Victorian Electoral Commission data. Please note that data are provisional and may be updated as the inquiry progresses.
For maps showing voter turnout rate and informal voting rate across Victoria in 2022, click the button below:
Voter participation and experience
Estimated eligible electors who cast a formal vote
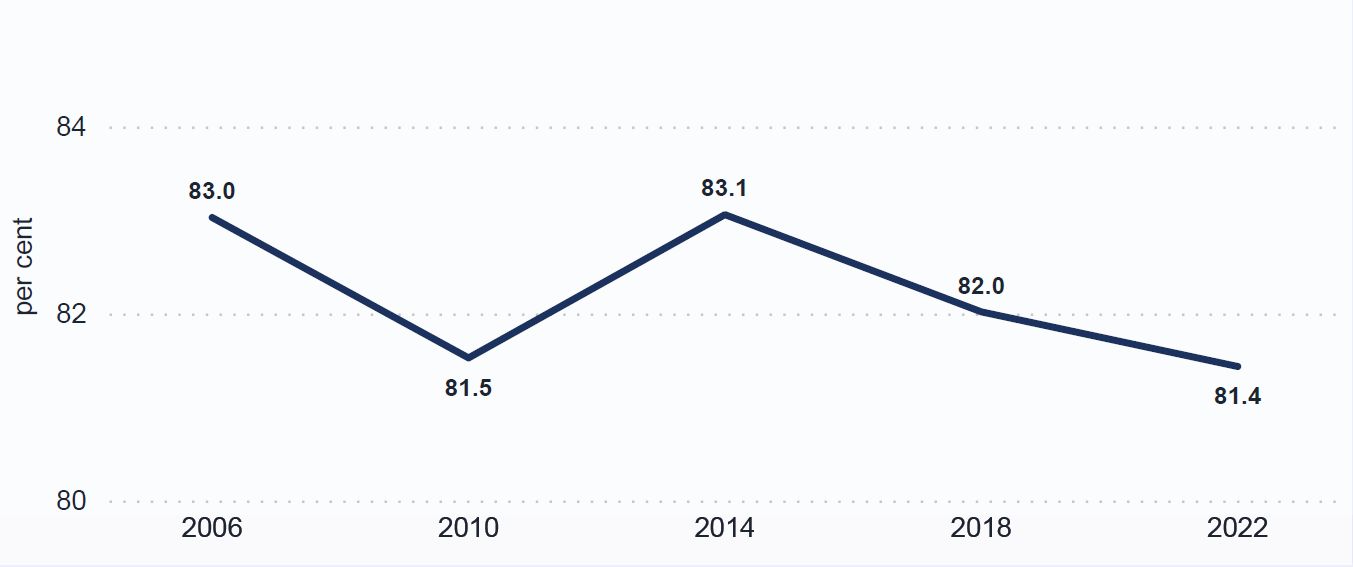
Note: Combines estimated enrolment, turnout and formality in the Lower House to give an overall indicator of participation.
Enrolment, turnout and formality
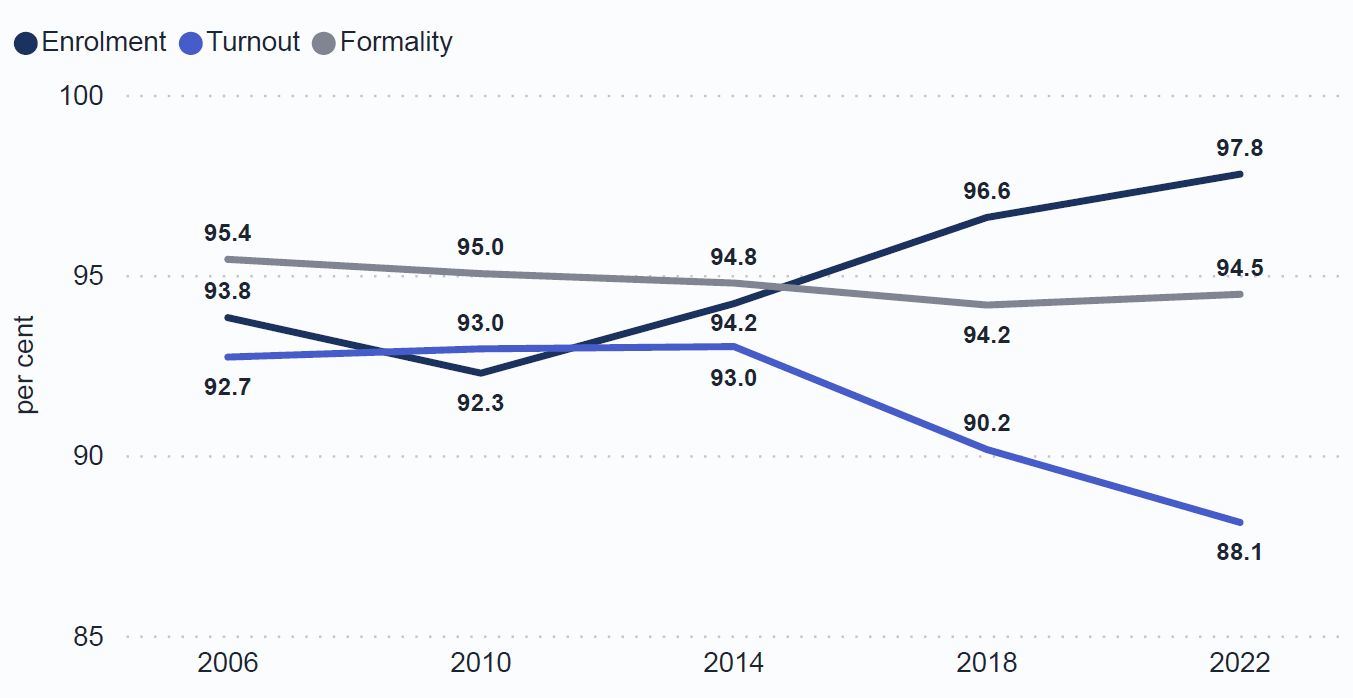
Note: Lower House turnout and formality. Enrolment rates are estimates as at 30 June in the year after the election (2006 and 2010), at election time (2014 and 2018) or in December following the election (2022).
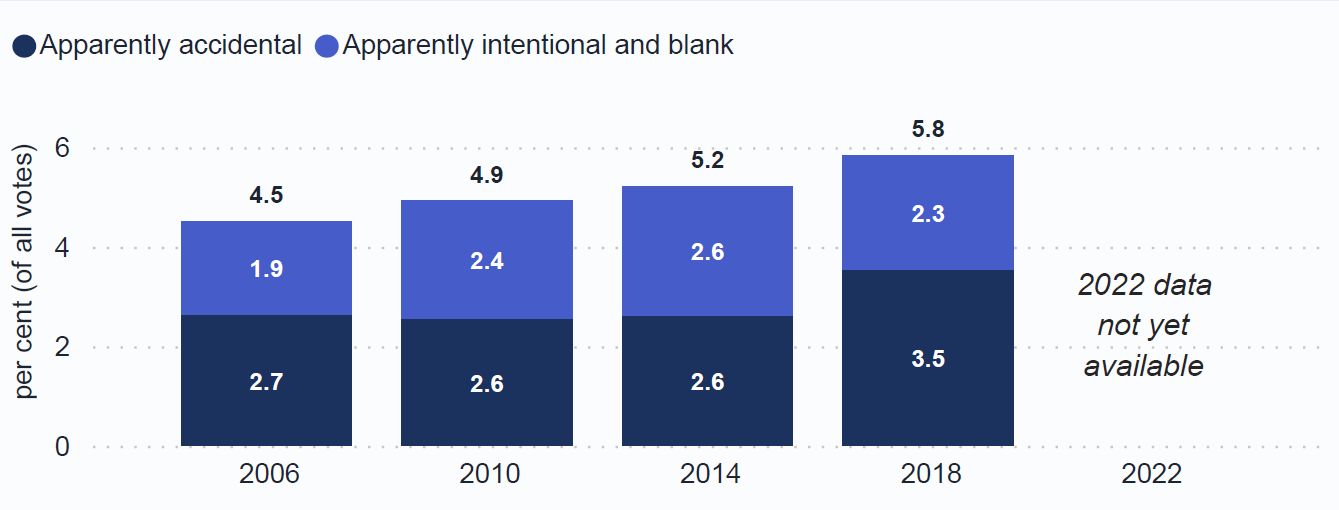
Types of informal votes (Lower House)
How people voted
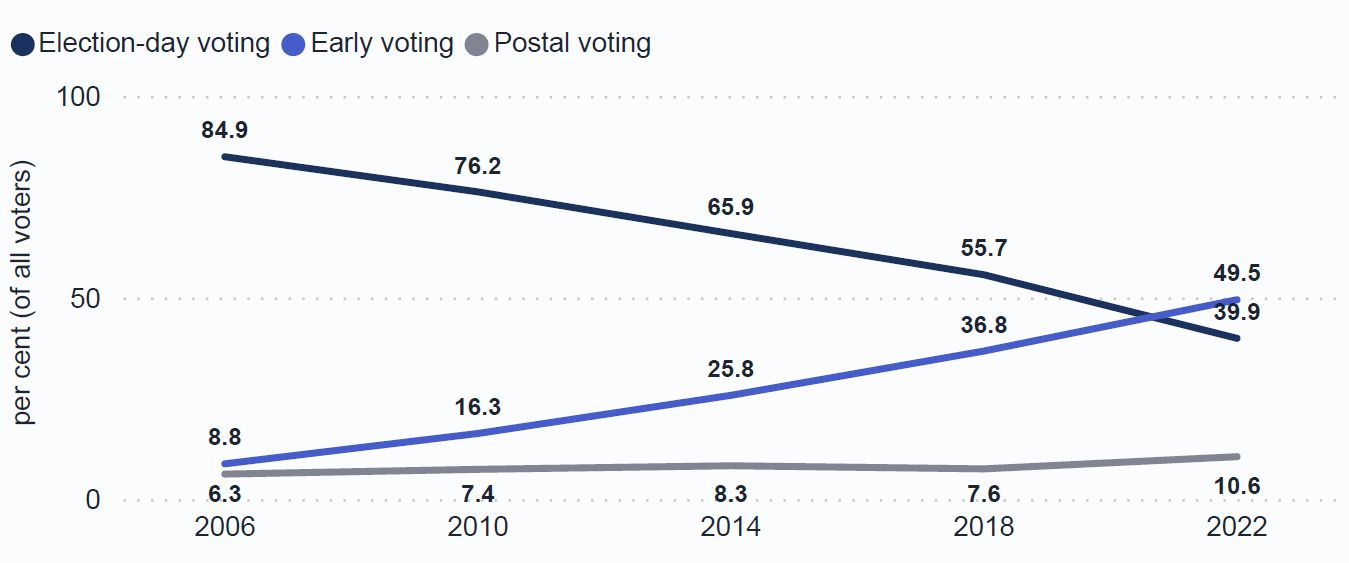
Note: Small numbers of voters are also classified into other categories (not shown).
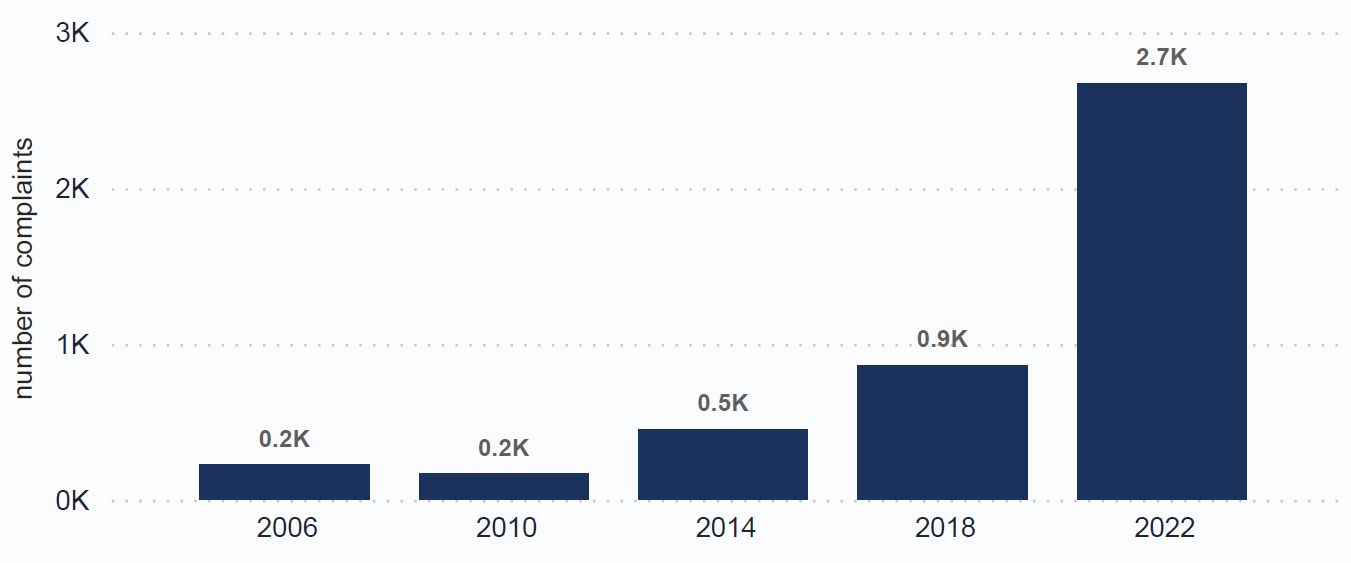
Formal complaints
Candidate participation and experience
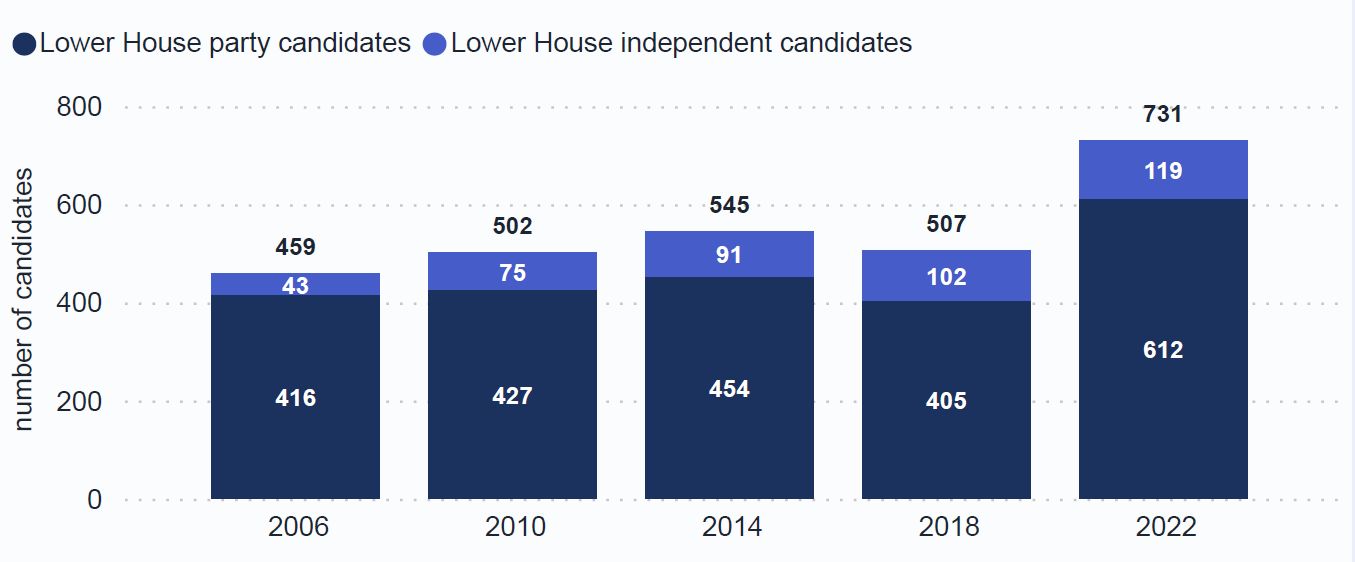
Number of Lower House candidates
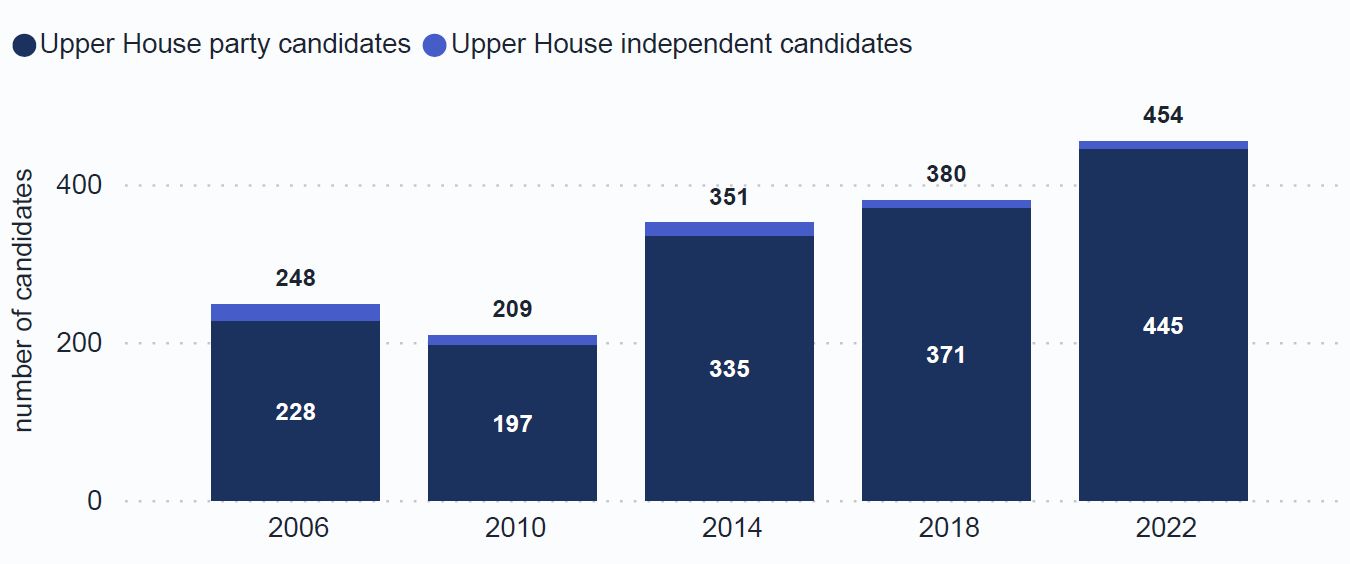
Number of Upper House candidates
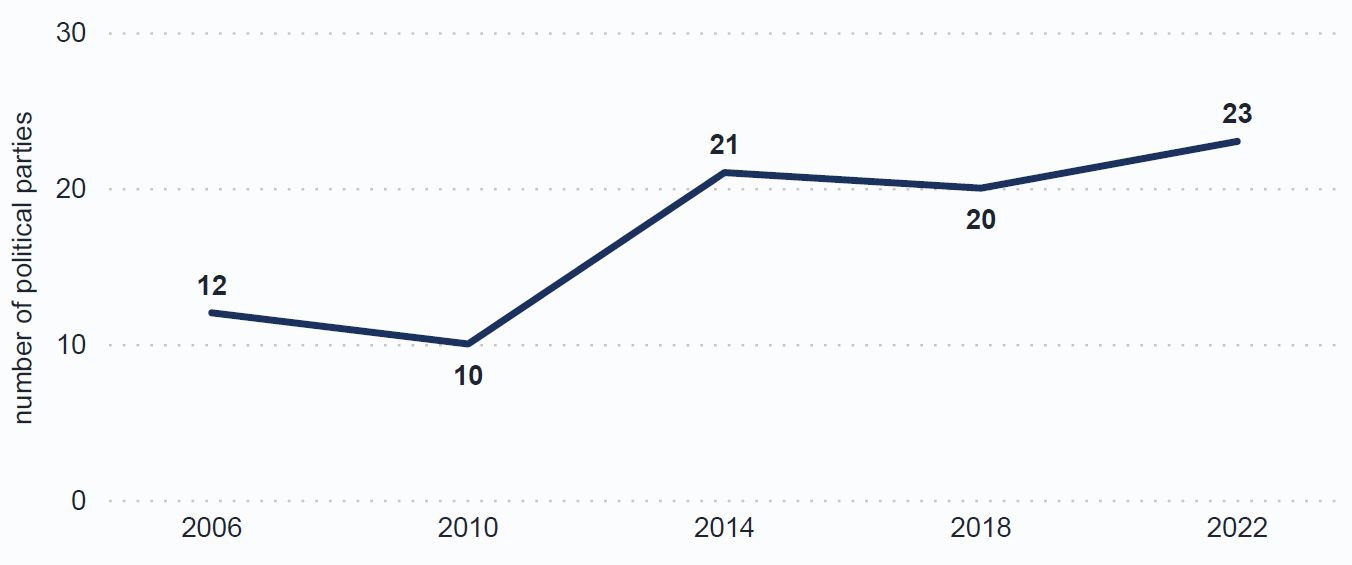
Number of political parties contesting the election
Candidate satisfaction with the VEC's electoral management
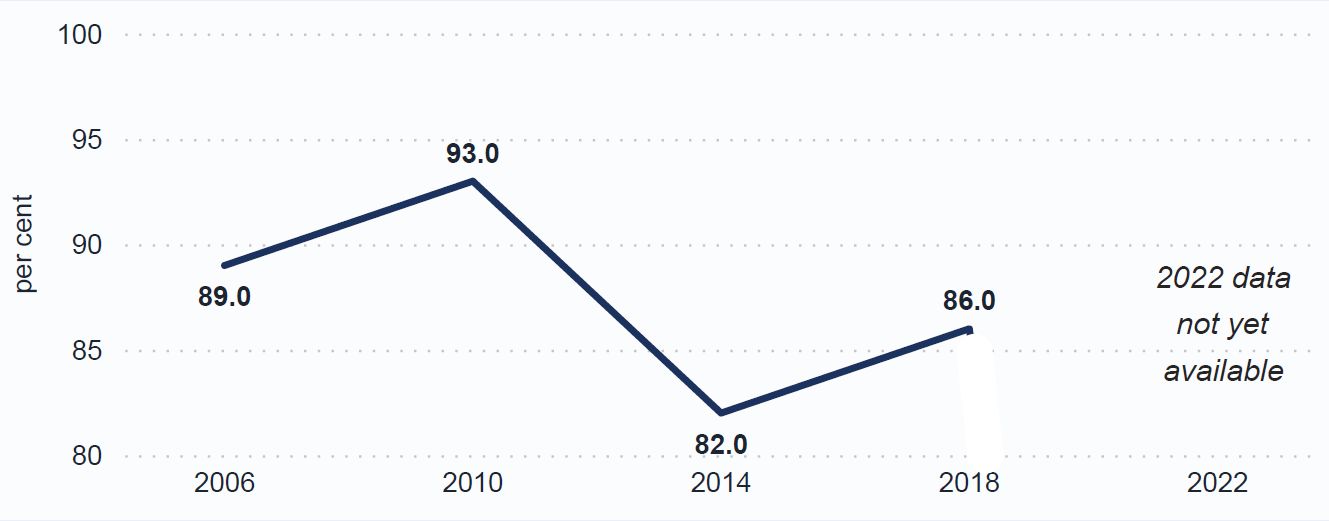
Note: Based on responses by candidates to questions about information provided and arrangements to assist voters on election day.
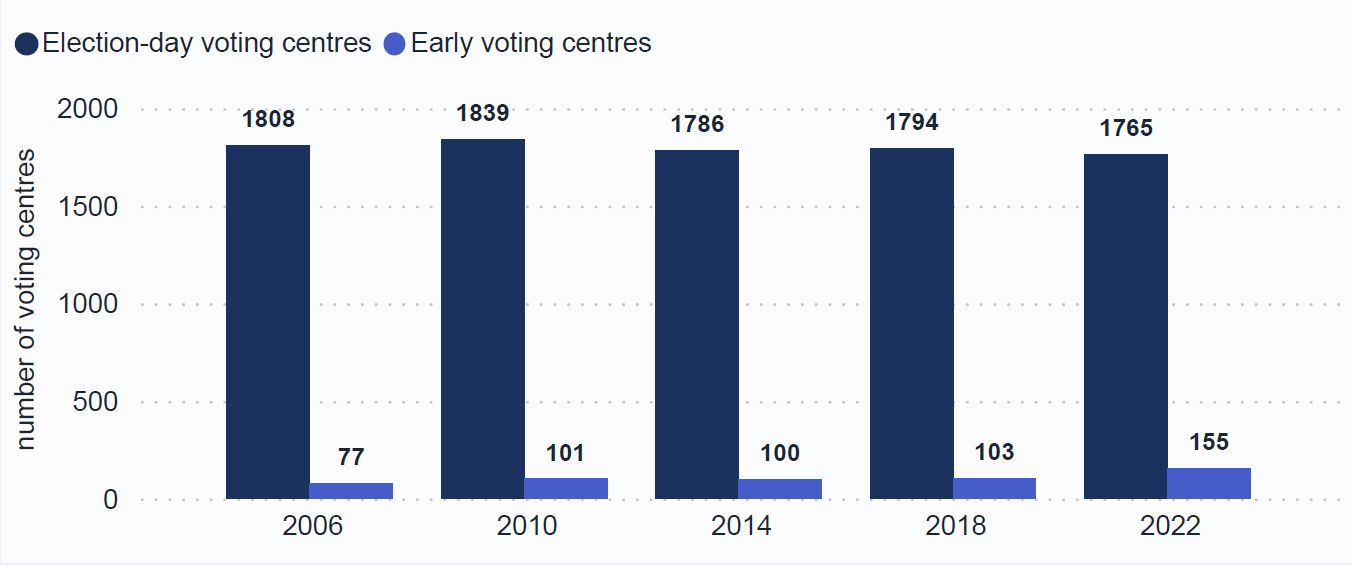
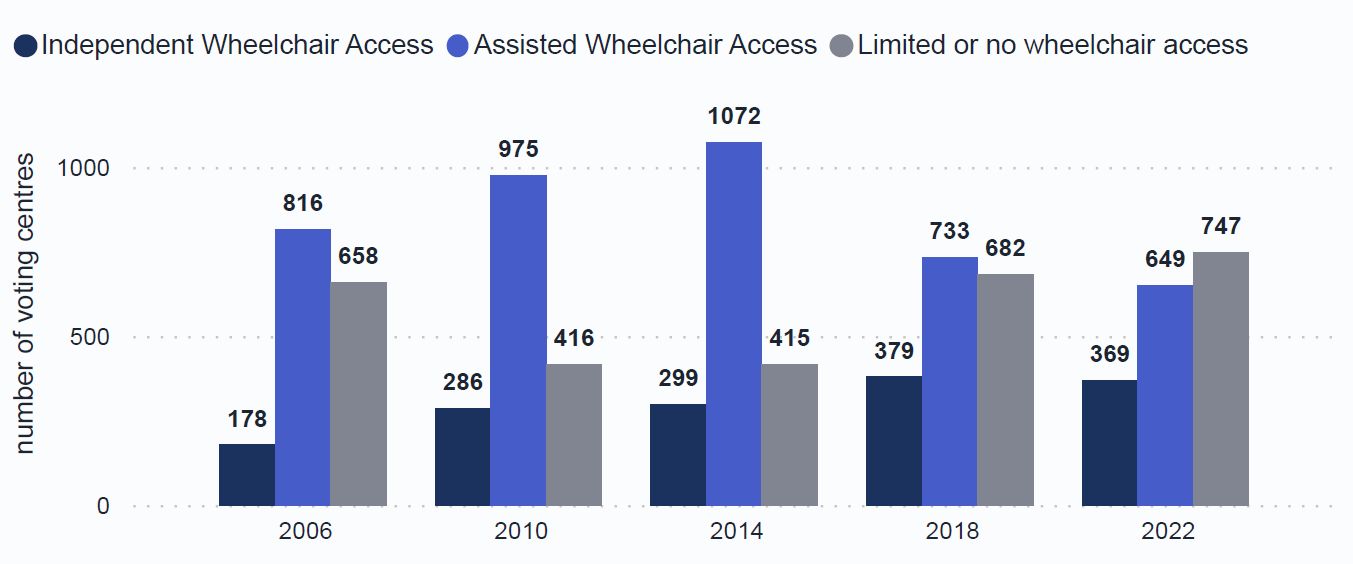
Voting centres
Number of voting centres
Election-day voting centre accessibility
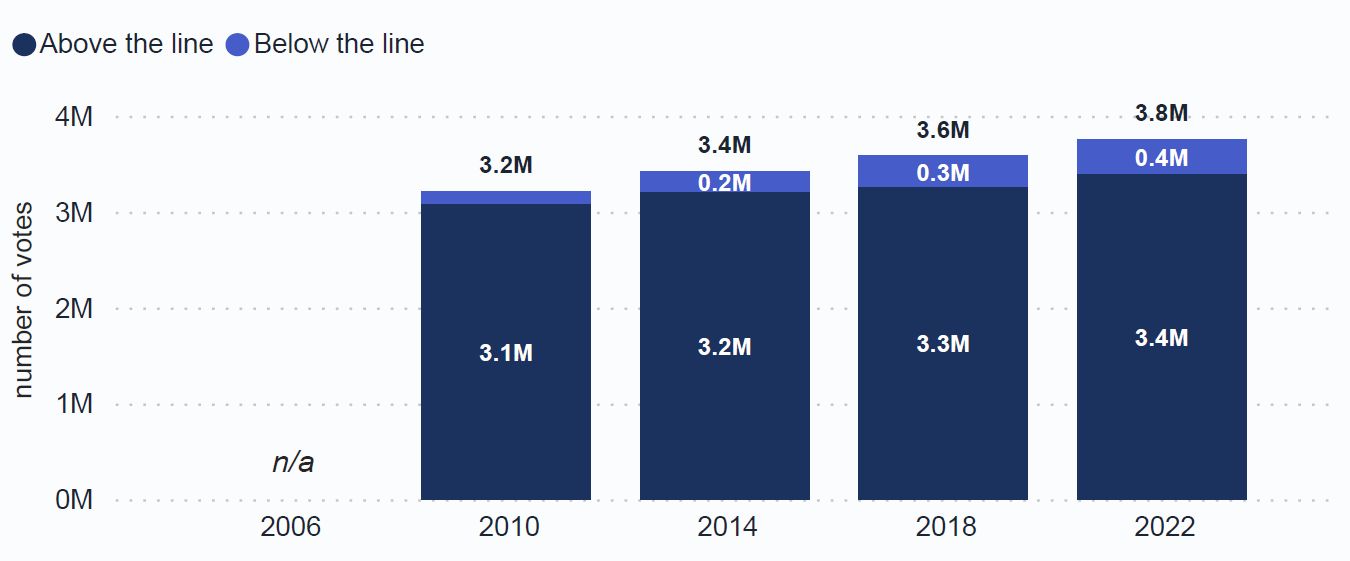
Upper House
Above the line and below the line voting (Upper House)
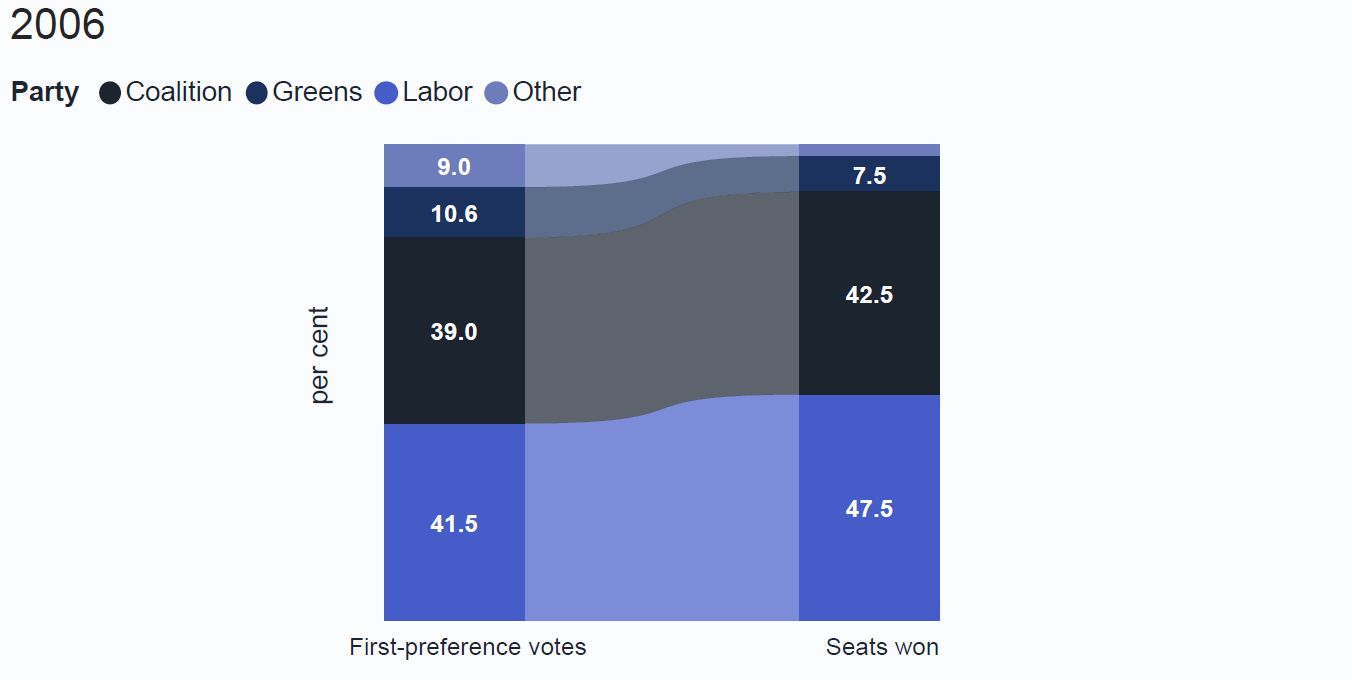
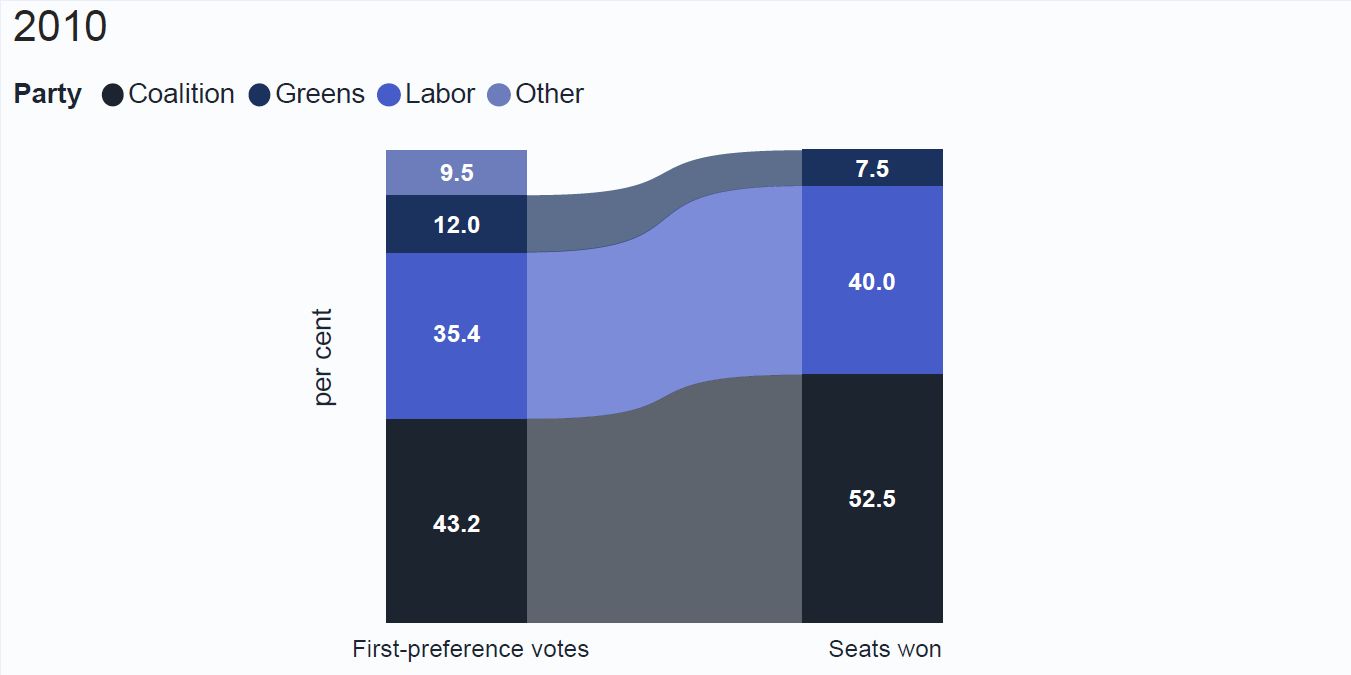
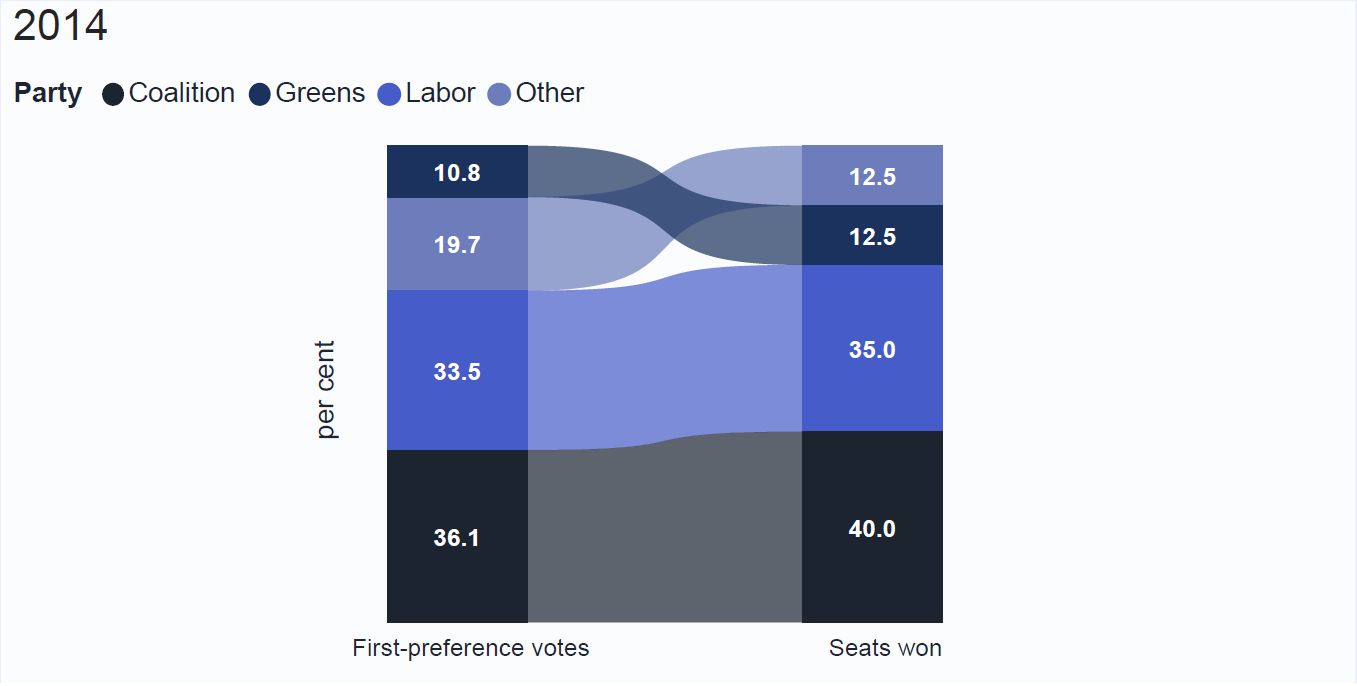
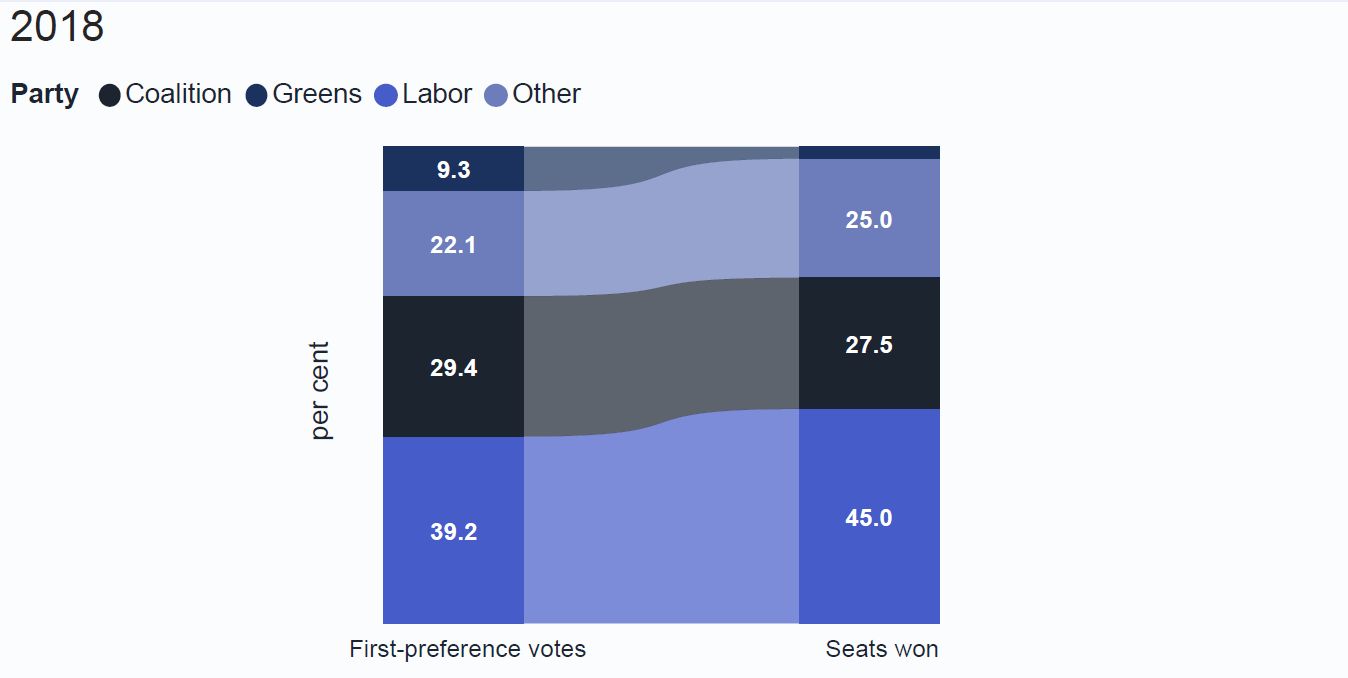
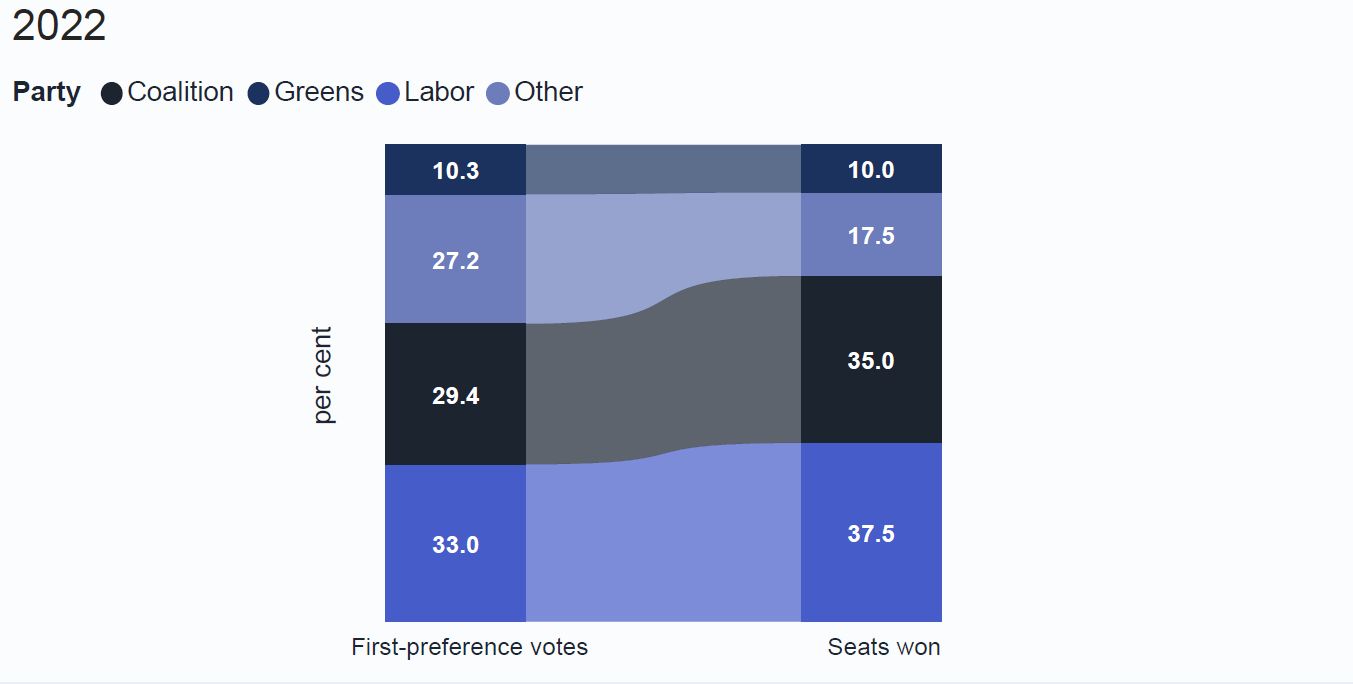
Comparisons of the proportions of first-preference votes to seats won